
Antimicrobial Resistance and Virulence Genes` Profiles of Staphylococcus aureus in Meat and Meat Products


Antimicrobial Resistance and Virulence Genes` Profiles of Staphylococcus aureus in Meat and Meat Products
Helal F. Al-Harthi1*, Essam H. Eldrehmy1,2, Afaf Eladl3, Marwa I Abd El-Hamid2*
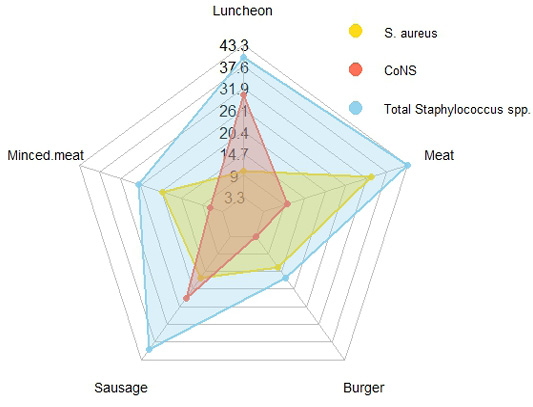
Prevalence of Staphylococcus species in the investigated meat and meat products samples. CoNS: coagulase-negative staphylococci.
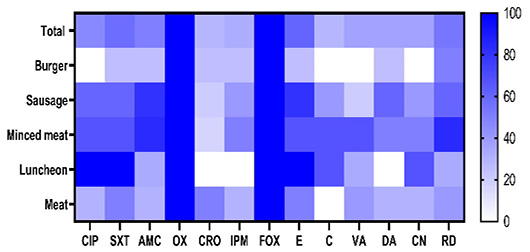
Frequency of resistance of Staphylococcus aureus isolates from meat and meat product samples to the antimicrobial agent. CIP: ciprofloxacin, SXT: trimethoprim-sulfamethoxazole, AMC: amoxycillin-clavulanic acid, OX: oxacillin, CRO: ceftriaxone, IPM: imipenem, FOX: cefoxitin; E: erythromycin, C: chloramphenicol, VA: vancomycin, DA: clindamycin, CN: gentamicin, and RD: rifampin. The antimicrobials resistance percentages are color-coded on the right of the figure.
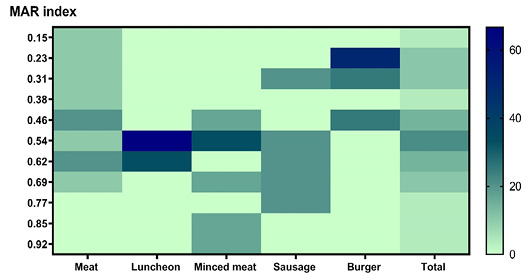
Multiple antibiotic resistance indices of Staphylococcus aureus isolates from meat and meat products samples. The antimicrobials resistance percentages are color-coded on the right of the figure.
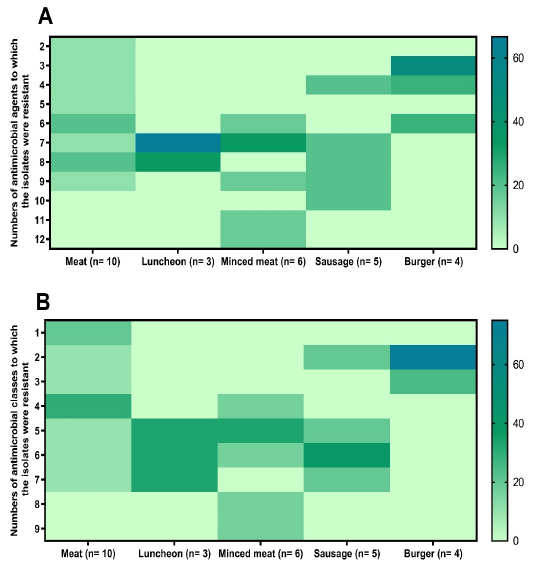
Antimicrobial resistance patterns of Staphylococcus aureus isolates from meat and meat products samples. n: number. The antimicrobials resistance percentages are color-coded on the right of the figure.
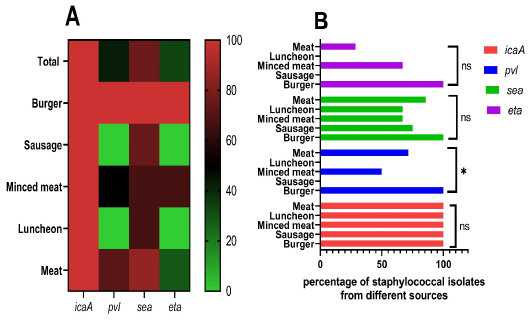
Distribution of virulence genes among Staphylococcus aureus from meat and meat product samples. (A) Heat map style, in which the percentages of virulence genes are color-coded on the right of the figure. (B) Columns style utilizing GraphPad prism, which displayed the percentages of S. aureus virulence-related genes from each sample type. icaA: intercellular adhesion A gene, pvl: Panton-Valentine leukocidin gene, sea: staphylococcal enterotoxin a gene, and eta: exfoliative toxin a gene.
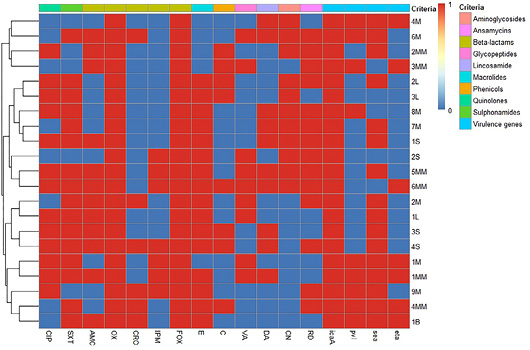
Heat map and hierarchical clustering of the tested Staphylococcus aureus isolates based on the occurrence of antimicrobial resistance, and virulence genes. In the heat map, red and blue colors represent the resistance/sensitivity to an antimicrobial agent and the presence/absence of a virulence gene. The code numbers on the left of the heat map and hierarchical clustering dendrogram represent the isolate code numbers for meat (M), luncheon (L), minced meat (MM), sausage (S), and burger (B) samples. CIP: ciprofloxacin, SXT: trimethoprim-sulfamethoxazole, AMC: amoxycillin-clavulanic acid, OX: oxacillin, CRO: ceftriaxone, IPM: imipenem, FOX: cefoxitin, E: erythromycin, C: chloramphenicol, VA: vancomycin, DA: clindamycin, CN: gentamicin, and RD: rifampin, icaA: intercellular adhesion A gene, pvl: Panton-Valentine leukocidin gene, sea: staphylococcal enterotoxin a gene and eta: exfoliative toxin a gene.
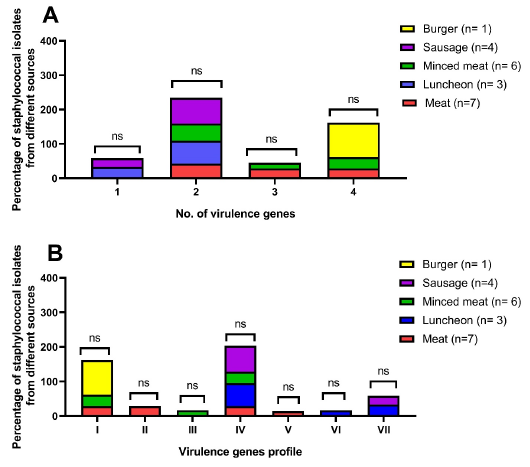
Distribution of the virulence genes (A) and virulence genes profiles (B) among methicillin-resistant Staphylococcus aureus isolates from meat and meat product samples. ns: non-significant, n: number, virulence gene profiles; I: icaA, pvl, sea, eta, II: icaA, pvl, sea, III: icaA, pvl, eta, IV: icaA, sea, V: icaA, pvl, VI: icaA, eta, and VII: icaA.

